Fundamental analysis (FA) and technical analysis are considered to be the two significant ways to analyse a company’s worth. In this article, let us examine how it works and what the differences are.
Fundamental analysis is a method of determining a security’s intrinsic value based on related economic and financial factors. It includes a complete study of the company’s financial statements for months or years ( balance sheet), strategic initiatives, microeconomic indicators, and consumer behaviour. So, a fundamental analyst needs to gauge economic, financial, non-financial, and other quantitative and qualitative factors.
Who uses Fundamental Analysis?
Fundamental analysis is mainly used by long-term and value investors to identify well-priced stocks and those with favourable prospects. Using FA, equity analysts generate price targets and recommend stocks to clients. One of the world’s most renowned value investors, Warren Buffett, promotes fundamental analysis.
Significance of FA: Fundamental analysis lets you predict future price movements and determine whether a stock is overvalued or undervalued. It is used for long-term investment opportunities. It can be used to identify the potential of a company’s stock by determining its true value.
How to Perform a fundamental analysis of stocks?
Knowing the company: The main objective to understand the company is to gauge the performance of the company, find out if it’s doing enough to achieve its financial goals, and whether to hold or sell its stocks. For such information, it’s pertinent to visit the company’s website and learn about its management, its promoters, and its products.
Analyze the company’s financial reports: Then analyzing a company’s finance; including its balance sheet, profit-loss statement, cash flow statement, operating costs, revenues; and expenses are required. The compounded annual growth rate (CAGR), sales, and if the net profit has increased for the last five years, it is indicative of its good health. It is highly important to know whether the company is stable, solvent, liquid, or profitable enough to justify the monetary investment.
Verify the debt: The debt factor can bring down a company’s performance. If it has a large debt then it is not suitable for you. While investing, look for a company with a debt/equity ratio of less than 1. Calculate it by dividing total assets by total liabilities in a company’s balance sheet.
Locate your company’s competitors: Find a company that is best performing compared to its competitors. It should have better prospects, upcoming projects, new plans, etc.
Assess the future prospects: Fundamental analysis is very useful if your investment is long-term. The best companies to invest in are the ones whose products can stay relevant for 15-25 years from now.
Review all aspects periodically: You must stay updated about the company that you wish to invest in. In case of any trouble, you should sell the stock of the company, So, be alert about the prospective entity.
What is Technical analysis?
A method of analyzing and predicting price movements in the financial markets is called Technical analysis. In this historical price, trends are analysed, patterns are seen on charts, and market statistics. In other words, it assumes that a trader can identify previous market patterns to predict accurately the price trends going forward.
The main objective of Technical analysis
With technical analysis, traders get to know when to enter and exit a market, especially when it starts to shift and keep emotions from affecting your decisions. A variety of indicators are used to analyze the charts to provide investment recommendations.
How do we analyze stock technically?
Several indicators are used to analyze the charts for recommendations regarding investment. Chart patterns and technical indicators are the two major types of technical analysis.
Indicators and Oscillators: An indicator is a tool used for making a trading chart clearer by applying mathematical formulas. A market trend or range can be ascertained with technical indicators. An oscillator constructs high and low bands between two extreme values and builds a trend indicator that fluctuates within these boundaries. With oscillators, stocks tend to remain within a range, a clearly defined upper and lower price limit.
Support and resistance: The terms ‘support’ and ‘resistance’ refer to two levels on a price chart that seem to limit the market’s movement. Specific price points on a chart that are expected to attract the most buying or selling are called support and resistance. A support price is one at which more buyers than sellers are likely to be found. On the other hand, a resistance price is one where there will be more sellers than buyers.
Technical analysis using charts: Chart types most commonly used by traders include the Line Chart, Candlestick Chart, Renko Chart, and Point and Figure Chart. A candlestick chart is by far the most popular method of technical analysis because it provides traders with more information while remaining easy to see at a glance.
What is a candlestick pattern?
Candlesticks are created by constant price movements. In bullish patterns, the price is likely to rise, while in bearish patterns, the price is likely to fall. During a trading period, the body of a candlestick represents the difference between the opening and closing prices, while the upper and lower wicks represent the highest and lowest price reached, respectively.
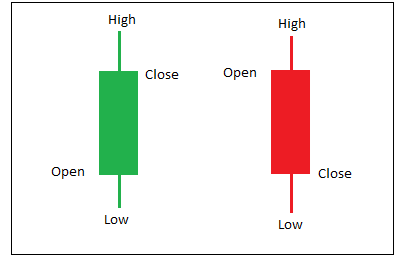
The green candle is called bullish, whereas red is bearish. Candlestick pattern is majorly employed as it has a high predictive value and can produce positive returns. Candlesticks and price action are both powerful trading concepts, and even research has confirmed it. Overall, Candlesticks provide unique insight into market movements because they signal market turning points early and indicate where the market is headed.