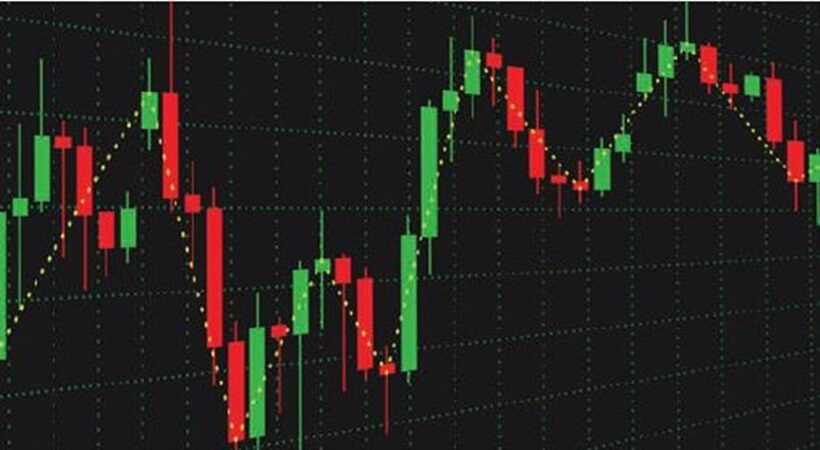
Candlestick charts are used in technical analysis to display the high, low, open and closing prices of a security over a certain period of time. There is a large part to the candlestick called the “real body.” This body represents the price range between the open and close on that day. Candlestick signals can be used to analyze any period of trading including daily, hourly and even minute-long cycles. Candlestick charts are used to make decisions in stock, forex, commodity and options trading.

Origin Of The Candlestick
Candlestick charts are believed to have been developed in the 18th century by Munehisa Homma, a Japanese rice trader. Steve Nison introduced them to the Western world in his book Japanese Candlestick Charting Techniques. Japanese candlestick charts are used to describe price movements of a security, derivative or currency. The Japanese Candlestick charting and analysis method is one of the most profitable methods of trading in the Indian as well as global market.
Know What A Candlestick Is Made Of?
To read candlestick lets have a deep understanding of its anatomy:
The hollow or filled portion of a candlestick is called the body. The long thin lines above and below depict the high or low of the definite time period, which is called a wick or tail. The highest point is marked as the topmost part as the upper shadow or a wick. Likewise, A day’s low is marked by the bottom part of the candle and is called a lower wick or tail.
Most Reliable Candlestick Patterns:
There are majorly 30 types of candlestick patterns available and among these the best and most reliable patterns are explained below.
Engulfing Pattern:
The two bars that comprise an engulfing candlestick pattern are used to indicate a market reversal. The second candlestick will be much longer than the first, so that it completely engulfs or covers the previous bar. Symbolically, it means that buyers have surpassed sellers or vice versa.
Bullish Engulfing Pattern:
Bullish engulfing patterns indicate a possible reversal of investors’ sentiment and suggest a stock has reached its minimum value during a given period. Consequently, the stock may experience an upward or bullish movement in the near future.
Bearish Engulfing Pattern:
The bearish engulfing pattern is a technical chart pattern that signals lower prices are ahead. It consists of an up candle (green) followed by a large down candle (red) that eclipses or engulfs the smaller up candle.
Hanging Man
Hanging man candlesticks occur during an uptrend and indicate that the price is about to start dropping. The candle has a small body, a long lower shadow and little or no upper shadow. Hanging men indicate an increase in selling interest.
Doji
A Doji candlestick forms when the close and open of security are nearly equal, and it generally signals a reversal pattern. The occurrence of an open and close price that are exactly the same is referred to as a “Doji” in Japanese, which means blunder or mistake.